

IDS employees regularly repair and perform testing on previously failing drives that are loaned to them from other large industries. Testing is completed through a half hour load test on the drive to determine the effectiveness of the repair. The power factor of the main facility at IDS drops to 0.20 and below during the time of load testing.
Demand Power factor is the ratio of working power (kW) to apparent power (KVA). It measures how effectively electrical power is being used. A high power factor (>0.90) signals efficient use while a low power factor (<0.90) indicates poor use. Utilities constantly track this metric and will penalize companies with a power factor below the required value as an incentive to implement solutions that lead to a more effective use of energy. This results in a lessened demand on the utility and a reduced cost to the customer.
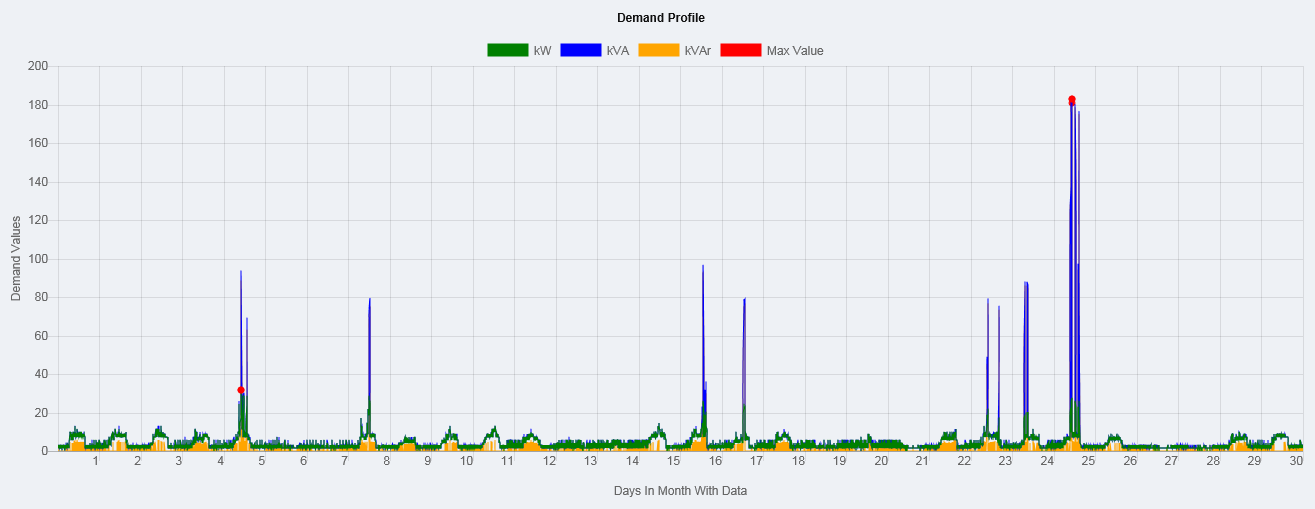
Figure 1: Demand Profile of IDS Facility April 2019
The power factor recording is measured over a time based minute window. Every 15 minutes the average power factor of the system is tracked to determine if its rating drops below 0.90. The lower the power factor the higher the demand penalty that is charged to them. However, only the power factor during the peak demand for each billing cycle of every month is used to determine the demand penalties for the hydro bill.
In the case above (Figure 1), the peak demand was reached on April 24th, 2019. At the time the peak demand measurement, during the month, was reached the power factor had dropped below 0.20 and a substantial penalty was administered by the utility due to the poor power factor.
In this example, at peak demand the kW demand for the month was approximately 36kW, while the kVA demand reading for the month was 180kVA.
Power Factor = 36kW / 180kVAR = 0.20
90% of the kVA reading is 162kVA.
Based on the utility billing structure, rates are applied to either the kW reading or 90% of the kVA reading. Because of the poor power factor in this instance, rates were applied to 90% of the kVA reading. The penalties that were billed are the difference between the kW reading and the 90% kVA reading, multiplied by the demand rates.
90% kVA – kW = 162 – 36 = 126
Demand Penalty = 126 x Demand Rate
These penalties can be completely avoided by correcting the electrical systems power factor so that it remains above 0.90.
Solution
To assist in developing a solution, the facility sought out the expertise of Cos Phi, a power factor correction and power quality company based in Hensall, Ontario. They were able to facilitate in the development of an effective customized solution.
The team reviewed the facility’s loads, historical data and monthly utility bills. After the review, the team at Cos Phi developed a fast switching power factor correction bank solution that would raise the power factor of the facility to acceptable levels.
The capacitor bank mainly consists of capacitors, detuning reactors, fuses and fast switching thyristor switches. The total capacitance of the bank is split into five steps of 60kVAR and is controlled by an intelligent monitoring controller. The controller tells each step to turn on individually as needed to adjust to the varying loads of the drive during the load testing. Each step is turned on by a fast switching electronic switch (thyristor) to limit the impact of transients as a large amount of capacitance is added to the system.
![]()
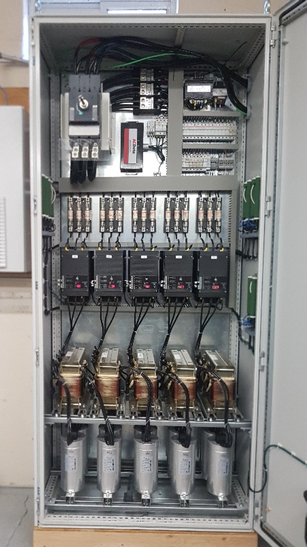
Figure 2: Cos Phi Power Factor Correction Bank
The automatic power factor correction bank was designed in order to maintain a pre-determined power factor rating of 0.90 during the peak demand of each month. Additionally its controller will monitor the system’s kW, kVA, kVAR, voltage, amps and harmonics.
Results
After applying the Cos Phi capacitor bank, Industrial Drive Service increased its average power factor level to above 0.90 during peak demands, avoiding significant demand penalties on their hydro bill. The new system increased the average power factor of the facility during load testing to 0.91. This exceeds the utility threshold (>0.90) for avoiding penalties.
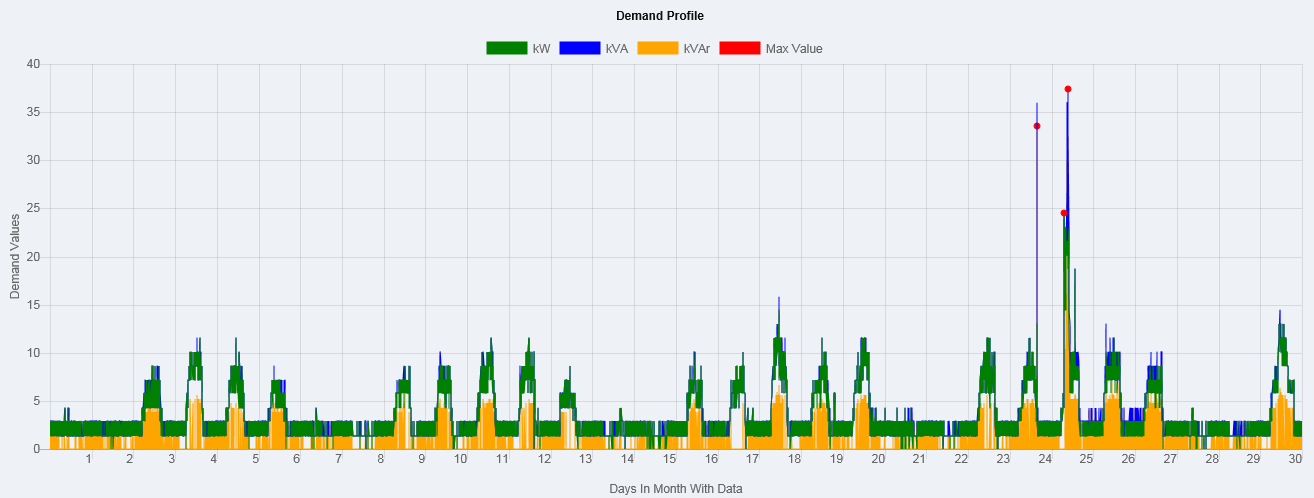
Figure 2: Demand Profile of IDS Facility September 2019
In the case above, the local utility now charged zero demand penalties to IDS on September 24th, 2019 when their 15 minute window reached the peak of that month. During this time the power factor averaged 0.91 throughout the load testing due to the increased capacitance on the system. Therefore no penalty was assessed and IDS received substantial savings on their hydro bill.
An additional benefit to the installation of the power factor correction bank is that it will free up 20-25% of the current kVA load on the transformer. This allows for additional equipment to be added to the facility without upgrading the system. The reduced load will also increase the life expectancy of the transformer and reduce C02 emissions.
For more information on how you can benefit from significant demand savings
through power factor correction please contact:
